
Self-hosted system monitoring for homelabs, the minimalist way.
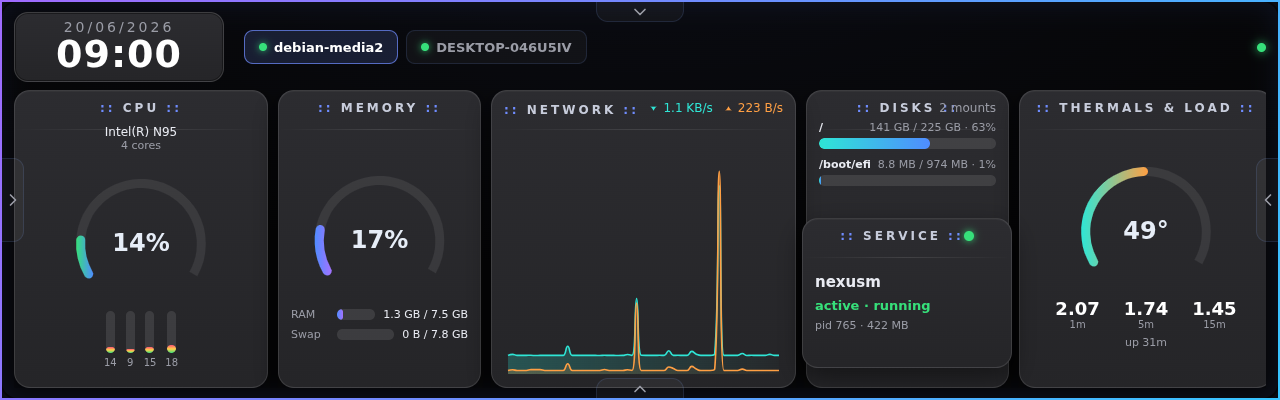
michka is a small, self-contained dashboard for watching your homelab and self-hosted servers, hardware and operating system alike. One binary serves a clean, touch-friendly board: CPU, memory, network, disk and temperatures from the hardware, plus the systemd or Windows services running on top, all live in your browser. The layout is tuned for the small, wide touchscreens that fit a mini-rack, panels such as 1280x400, 1424x280, 1920x440 and 1920x515, and it works just as well full-screen in any browser.
No agents to wire up by hand, no cloud account, no telemetry. It runs entirely on your own hardware and works completely offline. It's free and open source.
Features
- One self-contained binary. No runtime to install, no dependencies, no external services. Copy it and run it.
- Touch-first dashboard. A dark, freeform board of draggable boxes, designed for small rack touchscreens but at home in any browser.
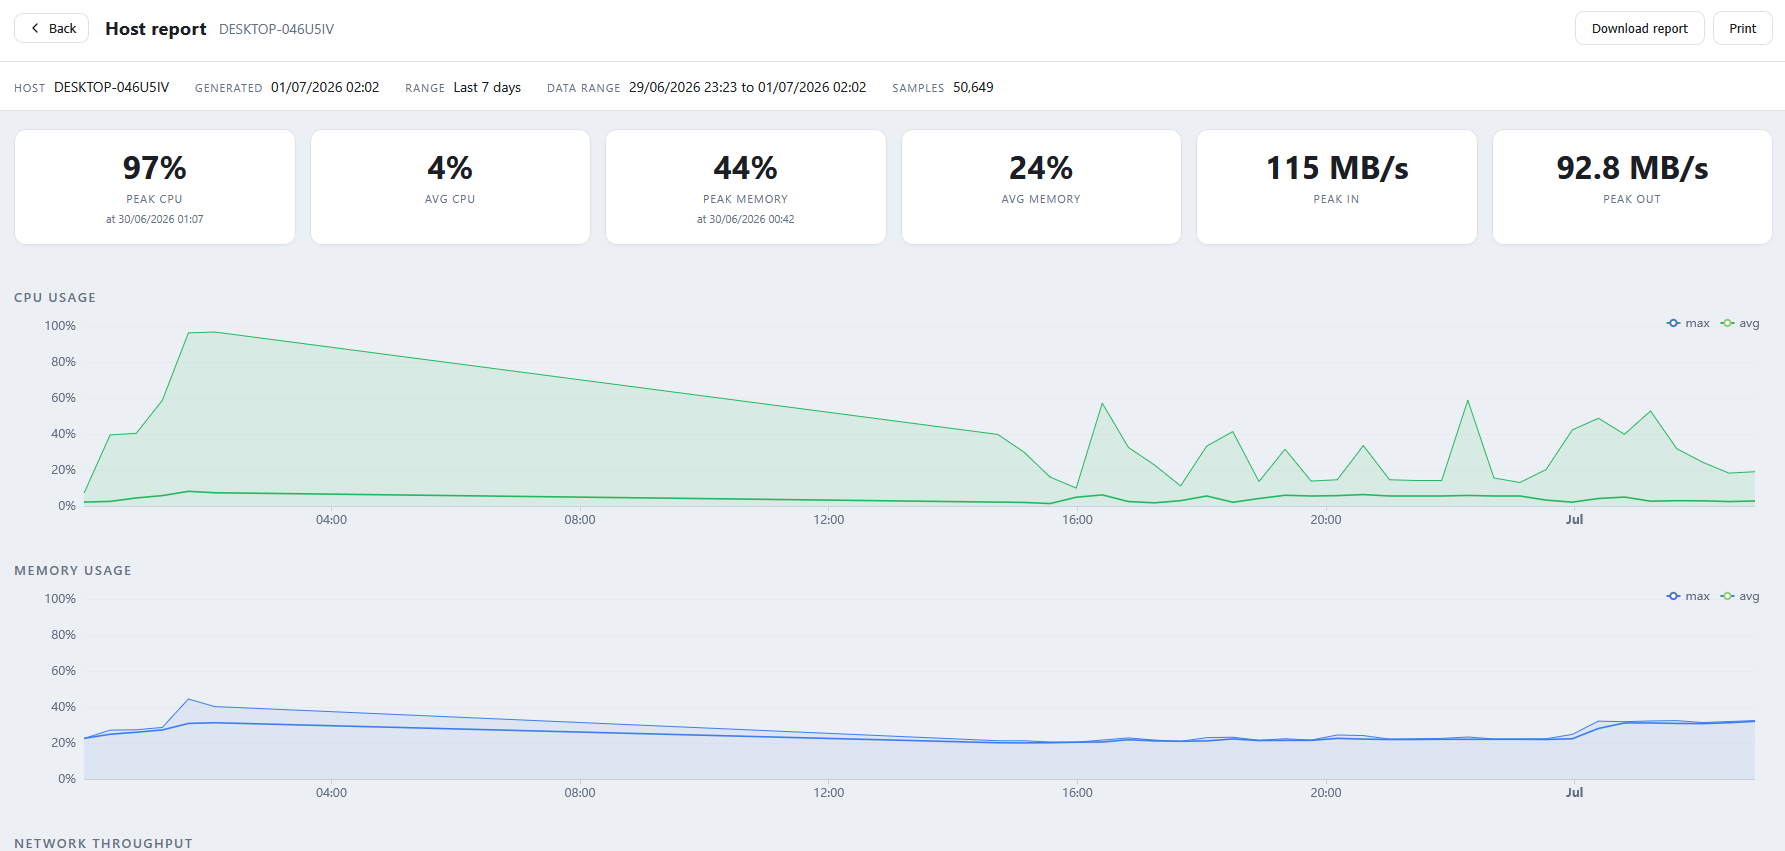
- Everything at a glance. CPU, memory, network throughput, disks, temperatures and load, updated live.
- Service monitoring. Watch systemd units on Linux and services on Windows; pick what matters on each machine.
- Hub and agents. One hub gathers metrics from many machines; lightweight agents push to it over your network.
- History, kept locally. Live updates stream over SSE and history is stored in a local SQLite file. Your data never leaves your network.
- Make it yours. Drop-in templates re-skin the dashboard and drop-in widgets add custom cards, with no rebuild required.
- Build your own. Templates and widgets are on-disk drop-in folders with a simple, documented format: design a full dashboard skin, or write a custom widget card against the built-in JavaScript API. Drop the folder in and michka discovers it live, with no recompiling or forking.
- Multilingual and offline. A built-in language picker, and every asset is embedded so it works with no internet connection.
Screenshots
A few looks at michka in action. Click an image to view it full size.
Download
Grab the latest build for your platform. The server (hub) serves the dashboard; the client (agent) reports a machine's metrics to a hub.
Server / Hub (michka_s)
Serves the dashboard, stores history and collects metrics. Run one per network.
| Platform | File |
|---|---|
| Debian / Ubuntu package | michka-hub_1.3.0_amd64.deb |
| Linux x64 (binary) | michka-1.3.0-linux-x64.tar.gz |
Client / Agent (michka_c)
Reports a machine's metrics to a hub. Run one on every machine you want to watch.
| Platform | File |
|---|---|
| Windows x64 | michka_c-1.5-win-x64.exe.zip |
| Debian / Ubuntu package | michka-agent_1.3.0_amd64.deb |
| Linux x64 (binary) | michka-1.3.0-linux-x64.tar.gz |
Kiosk add-on (optional)
For a dedicated touchscreen appliance: launches the dashboard full-screen at boot.
| Platform | File |
|---|---|
| Debian / Ubuntu package | michka-kiosk_1.3.0_amd64.deb |
Builds are self-contained, with no .NET runtime required. Verify your download against the published SHA-256 checksums.
Installation
Server / Hub
On Debian or Ubuntu, install the package and the hub starts on boot as an unprivileged service:
sudo apt install ./michka-hub_1.3.0_amd64.deb
# the dashboard is now at http://<this-host>:5000
Prefer a plain binary? Download the tarball, then run:
tar xzf michka-1.3.0-linux-x64.tar.gz
./michka-1.3.0-linux-x64/michka_s   # serves on port 5000 by default
Client / Agent
Install the agent on every machine you want to watch and point it at the hub:
sudo apt install ./michka-agent_1.3.0_amd64.deb
# set the hub address and access token (copy the token from the hub's Settings, Server):
sudo sh -c 'echo MICHKA_ARGS=\"--hub http://HUB-HOST:5000 --token YOUR-TOKEN\" > /etc/default/michka-agent'
sudo systemctl restart michka-agent
Or run the binary directly:
./michka_c --hub http://HUB-HOST:5000 --token YOUR-TOKEN --name my-machineWindows client
Download michka_c.exe and double-click it to open the settings window. Enter your hub address, then use Install service to run it in the background at startup. No console window appears.
Kiosk / appliance (optional)
On a dedicated device with a touchscreen, the optional kiosk package launches the dashboard full-screen at boot:
sudo apt install ./michka-kiosk_1.3.0_amd64.debUsage
Getting around
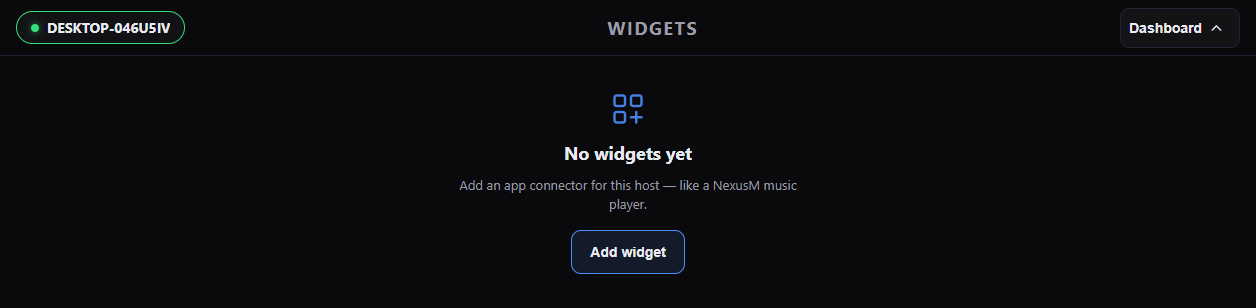
The interface is three side-by-side screens: services on the left, the dashboard in the middle, and settings on the right. Swipe, use the edge tabs, or the on-screen controls to move between them. From the dashboard, swipe up for live service status and down for widgets.
Arranging the board
The dashboard is a freeform board of boxes. Press and hold a box for about a second to pick it up, then drag to rearrange. Release in place to open a menu where you can add or remove boxes. Each machine keeps its own layout.
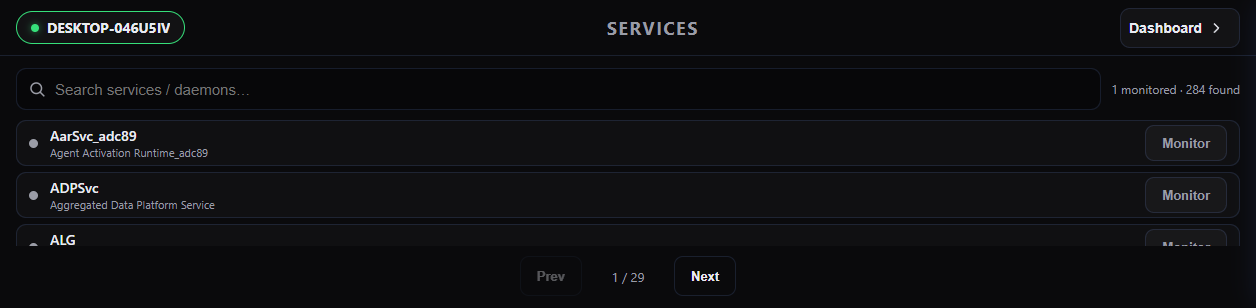
Monitoring services
Open the services screen to search a machine's services and choose which to watch. Selected services appear as live status bubbles and can be placed as boxes on the board.
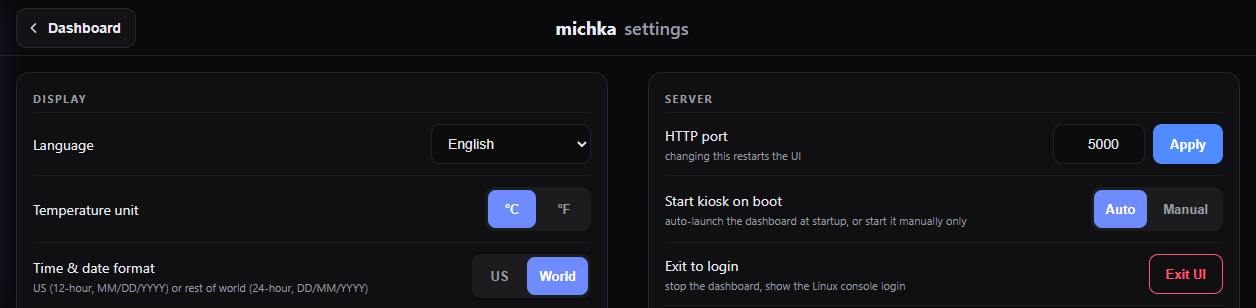
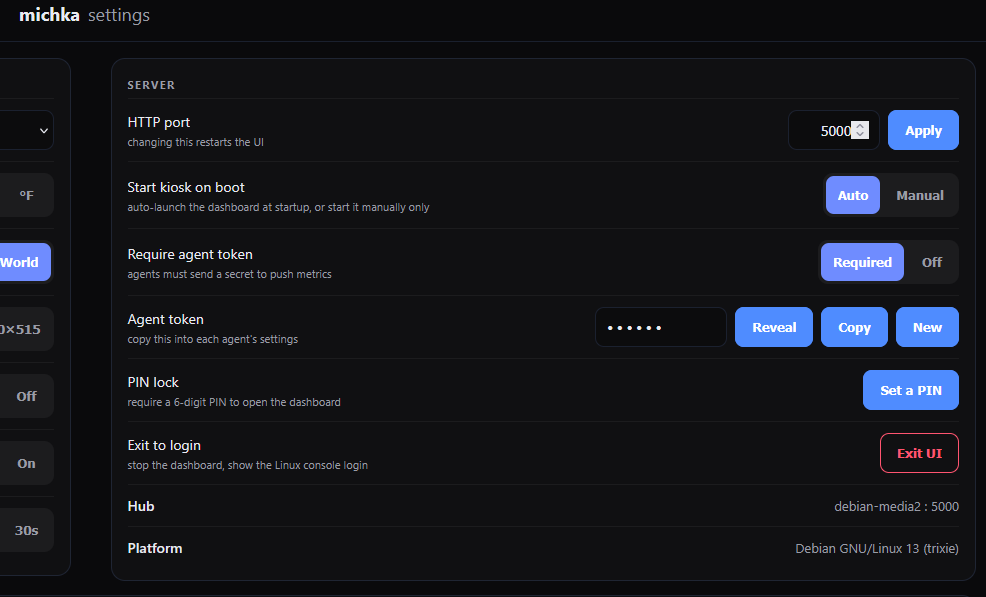
Settings
Set the HTTP port, interface language, temperature units, time format, screensaver and kiosk-on-boot behaviour from the settings screen. Changes apply live.
FAQ
- What is michka?
- michka is a self-hosted system monitoring dashboard for homelabs. It runs as a single small binary that serves a touch-friendly web dashboard showing the health of one or many machines.
- Which operating systems are supported?
- The hub and agents run on Linux (Debian is the primary target) and Windows. The dashboard itself runs in any modern browser.
- Does it need an internet connection?
- No. Every asset is embedded in the binary and all data stays on your network. michka works completely offline.
- How do I monitor more than one machine?
- Run the client (michka_c) on each machine and point it at your hub. Every machine then appears as its own tab on the dashboard.
- Can I monitor Windows machines?
- Yes, with the Windows client. Note that reliable CPU temperatures are not available to user-mode software on most Windows hardware, so Windows machines show disk activity, process counts and uptime in place of a temperature gauge.
- Where is my data stored?
- History is kept in a local SQLite file next to the binary. Nothing is sent anywhere else.
- How do I change the port?
- Set the HTTP port in the settings screen, or pass --port on the command line. The default is 5000.
- Can I change how it looks?
- Yes. Drop a template folder into the templates directory to re-skin the dashboard, or a widget folder into the widgets directory to add custom cards, with no rebuild needed.
- How much does it cost?
- michka is free to use on your own machines.
- Is it heavy?
- No. It is a single self-contained binary with no runtime to install and a small memory footprint, designed to run happily on modest hardware such as a mini-rack server or a small single-board computer.
Source
michka is open source. Browse the code, file issues or contribute on GitHub.